
Page 14 - Q3 Marketing Update
P. 14
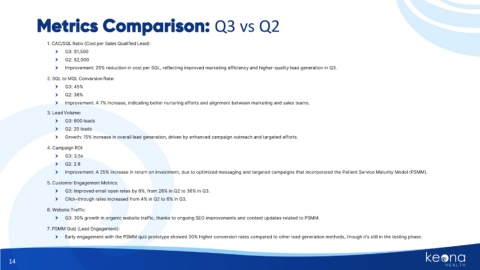
Metrics Comparison: Q3 vs Q2


                    1. CAC/SQL Ratio (Cost per Sales Qualified Lead):
                       •   Q3: $1,500
                       •   Q2: $2,000
                       •   Improvement: 25% reduction in cost per SQL, reflecting improved marketing efficiency and higher-quality lead generation in Q3.

                    2. SQL to MQL Conversion Rate:
                       •   Q3: 45%
                       •   Q2: 38%
                       •   Improvement: A 7% increase, indicating better nurturing efforts and alignment between marketing and sales teams.

                    3. Lead Volume:
                       •   Q3: 600 leads
                       •   Q2: 20 leads
                       •   Growth: 15% increase in overall lead generation, driven by enhanced campaign outreach and targeted efforts.
                    4. Campaign ROI:
                       •   Q3: 3.5x
                       •   Q2: 2.8
                       •   Improvement: A 25% increase in return on investment, due to optimized messaging and targeted campaigns that incorporated the Patient Service Maturity Model (PSMM).

                    5. Customer Engagement Metrics:
                       •   Q3: Improved email open rates by 8%, from 28% in Q2 to 36% in Q3.
                       •   Click-through rates increased from 4% in Q2 to 6% in Q3.

                    6. Website Traffic:
                       •   Q3: 30% growth in organic website traffic, thanks to ongoing SEO improvements and content updates related to PSMM.
                    7. PSMM Quiz (Lead Engagement):

                       •   Early engagement with the PSMM quiz prototype showed 20% higher conversion rates compared to other lead generation methods, though it’s still in the testing phase.


    14